Connect, monitor and understand distributed fluid infrastructure.
Water supply systems, treatment plants, wastewater facilities, pumping stations, reservoirs, distribution networks and process fluid installations are rarely managed by one system. Ecapso collects data from PLCs, RTUs, meters and sensors across all of them and turns it into one operational data layer, alongside existing SCADA.
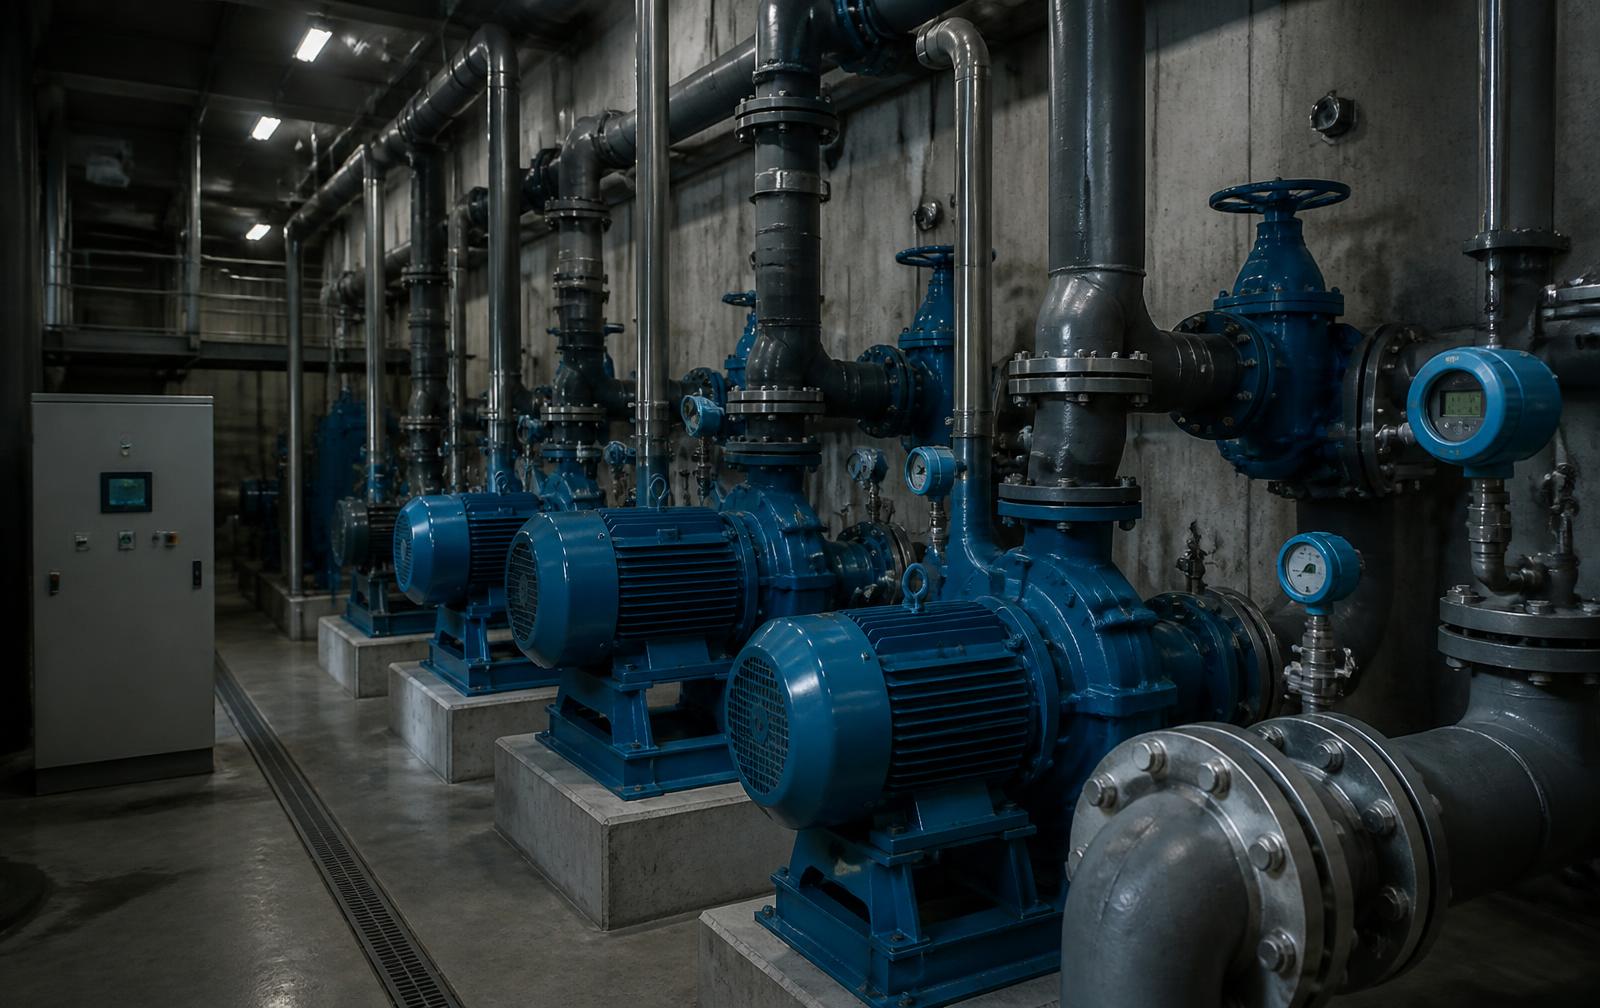
One data layer for water, wastewater and process fluids.
- 01Water source
- 02Treatment
- 03Pumping
- 04Reservoirs
- 05Distribution
- 06Consumers
- 01Process fluid
- 02Pumping
- 03Storage
- 04Treatment
- 05Distribution
- 06Consumption
- Flow
- Pressure
- Level
- Pump status
- Energy consumption
- Inflow and outflow
- Consumption
- Alarms
- Equipment health
- Abnormal flow differences
Connected water and fluid infrastructure in one operational data layer across distributed sites.
Water supply systems, treatment plants, reservoirs, pumping stations, distribution zones and remote telemetry locations rarely share one system. Ecapso Gateway collects data from PLCs, RTUs, meters and sensors across all of them and distributes it to the systems that need it.
From source to city
One operational picture across the whole supply chain: source and intake, treatment, pumping, storage, distribution zones and metered consumption.
- 011,240 m³/hSource and intake
Lake level, intake flow, screen condition
- 023 stagesTreatment
3 stages running, dosing and turbidity monitored
- 035.8 barPumping station
P1 and P2 running, P3 standby, energy per m³
- 0482.4 %Reservoir
Level, inflow and outflow balance
- 0518,420 m³/dayDistribution zones
Pressure and flow per district metering area
- 067.2 % lossConsumption
Metered consumption compared with zone inflow
Illustrative values, not live customer data
Water system architecture
Source to consumer
- 01Water source / reservoirLevel, quality, inflow
- 02Raw water intakeFlow, pump status, energy
- 03Water treatmentFiltration, dosing, quality
- 04Pumping stationPressure, flow, pump state
- 05ReservoirLevel, volume, in/out balance
- 06Distribution networkZone flow and pressure
- 07ConsumersMetered consumption
- PLC
- RTU
- Flow meter
- Pressure sensor
- Level sensor
- Water quality sensor
- Pump controller
- Energy meter
- Remote telemetry device
One operational data layer
Collection, validation, buffering, retry and health monitoring across geographically distributed water infrastructure.
- Ecapso Visualization
- Existing SCADA
- ERP
- BI
- Database
- APIs
- Other systems
Ecapso is a connectivity and data layer. It integrates with existing SCADA systems rather than replacing them.
Real-time water operations
Reservoir levels, inflow and outflow balance, pump states, pressure, flow and energy consumption, monitored continuously across the network.
- Pump 1running
- Pump 2standby
- Pump 1running
- Pump 2fault
Water distribution network monitoring
- 01 · Raw water intakeSource512 L/s
- 02 · Filtration & dosingTreatment482 L/s
- 03 · Storage bufferReservoir78.4%
- 04 · 2 stations onlinePumping stations5.8 bar
- Inlet flow
- 410 m³/h
- Outlet flow
- 396 m³/h
- Pressure
- 4.6 bar
- Consumption
- 392 m³/h
- Inlet flow
- 286 m³/h
- Outlet flow
- 279 m³/h
- Pressure
- 4.2 bar
- Consumption
- 274 m³/h
- Inlet flow
- 1,240 m³/h
- Outlet flow
- 1,105 m³/h
- Pressure
- 3.4 bar
- Consumption
- 1,105 m³/h
Illustrative operational values across a distribution network: source, treatment, storage, pumping and metered zones in one view.
Water loss & network monitoring
Ecapso compares water entering a distribution zone with measured consumption. Abnormal differences may indicate leakage, pipe damage, meter problems, abnormal consumption, pressure-related losses or instrumentation issues. Continuous monitoring of flow and pressure helps operators identify abnormal flow differences and prioritize investigation. It does not, on its own, prove a leak.
- Input to zone
- 1,240 m³/h
- Measured consumption
- 1,105 m³/h
- Difference
- 135 m³/h
Abnormal loss
Potential network loss detected. The difference between zone input and measured consumption is widening.
- 01 · Normal operationFlow and pressure within expected band
- 02 · DeviationFlow rising while pressure drops
- 03 · Abnormal conditionDeviation exceeds configured threshold
- 04 · InvestigationAlarm raised, zone prioritized for field check
Water treatment & sludge process monitoring
Ecapso collects and monitors these signals. Process control stays with the existing PLC, RTU and SCADA layer.
Remote water infrastructure
One operational data layer across distributed infrastructure
Every remote location reports connection state, data throughput and buffering status back to a single operational view.
Water operations KPIs
Water alarms
- Critical12:18
Pump failure, Station 02
Unacknowledged
- Warning12:02
Pressure deviation, Zone 04
Acknowledged
- Warning11:36
Reservoir level below threshold, Reservoir B
Acknowledged
- Info08:40
Maintenance runtime threshold reached, Sludge pump 1
Closed
Sample values shown for illustration